|
Visual understanding in designing the explanatory processes of the educational software
In
the new age of the information technology there is a need to find new
methods of educational software design. In educational software, where
visualization plays a key role, there is a need to pay more attention to
the development of the visual thinking capabilities of the students.
Learning abilities are part of the cognitive capabilities of the student
and good knowledge of the processes connected with learning is needed to
design ‘good’ educational software. The visual system that is able to
perform visual reasoning and visual inference provides the knowledge about
learning of the visual information. This project is continuation of the
research in designing the educational software that started in Poland
in 1985. The investigations of the capabilities of the educational software
to explain the arithmetical operation (software “wielomian”)
lead to application of the Mathematica in
designing the explanatory expert. The methods of visualisation of
mathematical (scientific) concepts will be further elaborated in this
research. The explanatory expert is designed in
the context of earlier proposed method of the System of Integrated
Packages.
Visual
explanation plays a key role in the process of learning and understanding and
it is exemplified by the System of Integrated Packages (SIP). The System of
Integrated Packages uses COM/DCOM technologies to automatize
the collaboration of the existing software packages such as Excel with the
Explanatory Expert. The Explanatory Expert is part of the System of
Integrated Packages where visualization is regarded at two levels, data
visualization and concept visualization. Example of concept visualization
is shown below. In the present research the Explanatory Expert is applied
to explain the statistical concepts.
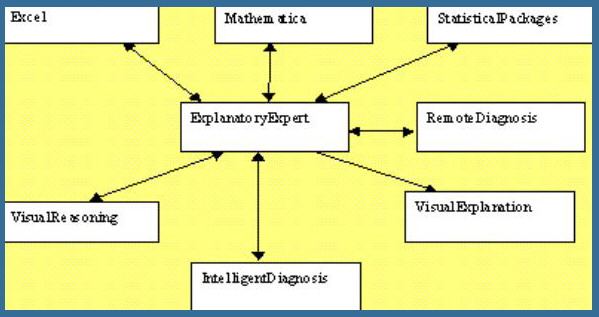
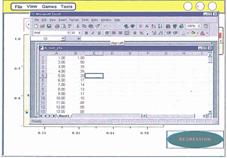
Schema of the System of Integrated Packages b. Example of application of the
COM technologies to automatize the collaboration of the SIP packages with Excel
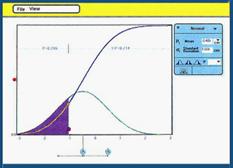
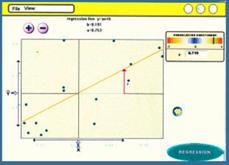
Example of the concept visualization a. cumulative
distribution b. regression analysis
Schema
of the Expert (part of the SUS) that communicates with MathKernel via
MathLink.
|